Claude Dashboards and Claude Motion: how they could change marketing teams for the better
Anthropic's Claude Dashboards and Claude Motion are in beta. What they are, who gets them, how they could change a marketing team for the better (fewer questions waiting for a ticket, numbers that show their query, explainers you can edit) and what to check first.
On October 8, 2026, Anthropic put two new things into beta, and both aim at work I think marketing teams will recognize: waiting for numbers and turning them into slides. Anthropic describes Claude Dashboards as turning a question about your company’s data into a dashboard that stays current, and Claude Motion as turning your content into a short animated explainer that you can edit and export as video. If they work as described, I think they could change a marketing team’s week for the better. Below: what they are, how I think they could help and what a team should check before it trusts them.
Two disclosures. I build this site with Claude Code, so I am not neutral about Anthropic’s products. And I have not used Dashboards or Motion: this rests on Anthropic’s announcement and four Help Center pages, read on October 12, four days after the release. As on the rest of this site, the article and its picture were written by an agent, with the tests as the gate.
Claude Dashboards builds a dashboard from a plain-language question about your data, and Claude Motion builds a short animation from your content. Both are in beta, announced on October 8, 2026, and both are artifacts, in the same workspace as Claude’s docs, slides and designs.
Feature
Claude Dashboards
Claude Motion
What it makes
A dashboard, with a SQL query behind every chart
A short animation of your text, charts, shapes and images, built as code
What it reads
A data warehouse (such as Amazon Redshift, BigQuery, ClickHouse, Databricks or Snowflake) or an app you connected to Claude (for example Salesforce)
What you give it: a report, data, images
What you can see or change
Each chart’s query and when its data was last refreshed
Any word, number or timing, because the animation is code
Where it goes next
Amplitude, Grafana, Hex, Mixpanel, Omni, Perplexity, PostHog or Sigma, with Looker, monday.com and Tableau coming soon
An MP4 file, or Adobe, Descript, HeyGen, Higgsfield, invideo, Luma AI or Runway, with Canva and Captions coming soon
Plans
Beta on Pro, Max, Team and Enterprise
Beta on Team and Enterprise
Default
Off on Enterprise until an owner turns it on
On by default on Team, off on Enterprise until an owner turns it on
Both count toward your plan’s usage limits, and a long or elaborate animation draws on them more than an ordinary message does.
How could Claude Dashboards help a marketing team?#
By making a question cheaper to ask and every answer easier to check, if it works as described.
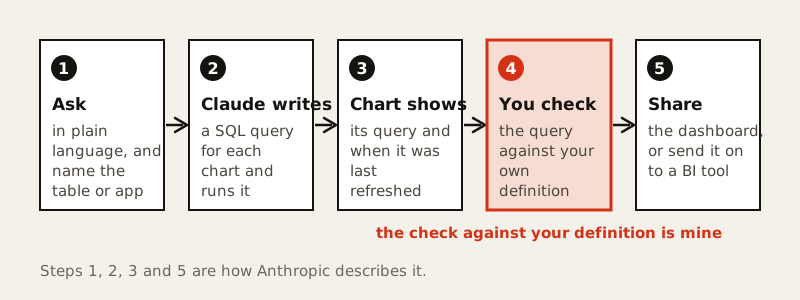
Fewer questions wait for a ticket. Anthropic says questions about company data usually mean a ticket or SQL, so people wait or skip them. The Dashboards guide’s example of a good question is how this month’s signups by channel compare with last month’s, an ordinary marketing question. You describe it, and Claude writes the queries and builds the dashboard.
Every number shows its work. Each chart displays its query and the time its data was last refreshed, and clicking a number opens that query or lets you ask Claude to explain it. I think many marketing arguments are about definitions: which conversions, which window, which revenue, as in the three revenues that Meta, GA4 and a store report. A visible query could turn that argument into a review.
The Monday export could become a link. Anthropic says a dashboard stays up to date as the underlying data changes. That could replace the spreadsheet someone refreshes by hand, so a meeting starts from the dashboard instead of a pasted screenshot of it. Each viewer uses their own access to the data, which the checks below cover.
Analysts keep the hard questions. Anthropic positions dashboards for quick, exploratory questions and points deeper work to the BI and analytics tools in the table. I think that is a good division: the easy questions get cheaper and the analyst’s time goes to the hard ones.
Steps 1, 2, 3 and 5 are how Anthropic describes it. In step 4 Anthropic says to check the query. Comparing it with your own definition is my addition.
By turning a results slide into a short explainer whose words, numbers and timing you can still change.
The report that needs more than a slide. Anthropic’s examples include turning a quarterly report into a 30-second all-hands explainer, animating how pricing plans compare for a sales kickoff, and a walkthrough for onboarding new customers. Anthropic’s observation is that an idea that would work better animated tends to become a plain slide. For a marketing team I would start with the monthly results review.
A change stays small. An animation is code, so a single detail such as one word, one number or the timing can change while everything else stays put. Ask Claude in the chat or adjust it in the editor.
No generated footage. Motion does not rely on a video generation model, so nothing in it is generated footage or an AI-generated person. It animates your own text, charts, shapes and images, which is what I would want in a results explainer.
Polish elsewhere. Export the MP4, or open it in one of the video tools in the table when it needs finishing work.
Anthropic frames Motion as a tool for explaining your own material. I read that as an explainer tool, not an ad maker.
Mostly the shape of the work: less waiting and reformatting, more asking, checking and deciding. This part is my view, not Anthropic’s.
Definitions get written down. When the query is on screen next to the number, what counts as a conversion could stop living in one person’s head.
Marketers become better askers. Anthropic’s tip is to describe the question you want answered rather than only the chart, and to name the table or app. That is a skill, and I think it is cheaper to learn than SQL.
Analysts become reviewers. The job could shift toward owning definitions, reviewing queries and taking the questions a dashboard should not answer alone.
The meeting changes. If everyone who needs the numbers can open the dashboard with their own access, the first ten minutes need not be a readout.
Who
What could get better
What to check
Channel manager
Channel and campaign questions get answered without a queue
That the table is named and the query matches the report
Analyst or marketing ops
Less time on one-off pulls, more on definitions and review
Who owns each definition
Head of marketing
Opens a dashboard and sees where each number comes from
That they can reach the data source with their own access
Agency or client
A Motion explainer to send as an MP4, and a shared view where the settings allow it
Dashboards that use connected data may not work for people outside your organization
Admin
Decides which templates are on, and on Enterprise which groups get them
Dashboards are off by default on Enterprise, and outside sharing is two separate settings
Docs, Slides and Design left beta on the same day and are now available on every plan, including Free; on Enterprise they turn on by default on October 15. Four details matter to a marketing team.
Decks that keep their formatting. Exports to PowerPoint and PDF keep the formatting from the editor, and a deck can go to Google Slides as an editable file.
Your design system. New designs and decks can pick up your colors, fonts and components.
One workspace with the team. People on your team and Claude can edit the same doc, deck, design or dashboard together.
A date. Standalone Claude Design at claude.ai/design stays until December 14, 2026, and design systems can be migrated before then.
Four things: the query behind each chart, who can see what, how far a shared link reaches and what the warehouse holds.
The query. Open it for every chart you will put in front of someone and compare its definition with the one your reports use. The Dashboards guide’s advice is to hand corrections back to Claude when a chart counts something other than what you meant.
Who can see what. The Share artifacts page says a viewer opens an artifact with their own access, so one that draws on connected apps runs on the viewer’s connections instead of yours, and a data source they cannot reach shows an error where your data would be. The admin guide adds that every user connects their own apps, including inside an artifact someone shared. I think that is sensible, and it means a dashboard is not a window you hand to a client. A new dashboard starts private to you.
How far a link reaches. The announcement says dashboards can be shared outside your organization, or with anyone who has the link, if your admin allows it. The Share artifacts page and the admin guide say artifacts that connect to your apps cannot use “anyone with the link”, and that people need a Claude account to open an artifact. These do not obviously agree, and no page I read says which governs a dashboard built on a warehouse. Try a link with someone outside your organization before you promise it to a client.
What the warehouse holds. Marketing data often includes customer-level records. The admin guide says an admin can switch artifact connectors on or off for the whole organization but cannot limit which apps they reach, and that on a HIPAA-ready configuration these templates are not covered by the Business Associate Agreement. Decide what the connected identity may read, in the spirit of a read-only setup for agents. That last part is my addition, not something the pages say.
Small, with the questions people already wait for.
Write down three questions your team waits on someone else to answer.
Ask each one as a question, and name the table or app, as the Dashboards guide advises.
Open every chart’s query and compare it with the definition in your current report. Fix the question until they match.
Replace one recurring slide with a dashboard link for a month, for people who can reach the data themselves, and see whether anyone asks for the slide.
For the next results review, ask for a 30-second Motion explainer. Tell it who will watch, where and for how long.
Decide with whoever administers Claude who may share outside the team.
A first question can be as plain as this, adapted from the examples in the guide:
From the signups table, chart signups per week over the past six months,
broken down by channel, with a filter for country.
A few things a marketing team would want to know before it commits.
How often a dashboard refreshes. Each chart shows when its data was last refreshed, and the announcement says a dashboard stays up to date as the underlying data changes. No page I read gives a schedule.
Which marketing sources connect. The pages give five warehouses and Salesforce as examples and say it works with your other connectors. They name no ad platform or analytics tool as a source: Amplitude and Mixpanel appear only as places to send a dashboard. A team whose numbers are not in a warehouse should check the connector list first.
Warehouse load. Every chart is backed by a query that Claude writes and runs against your connected data, and in a warehouse a query is somebody’s compute. The pages say Dashboards counts toward your plan’s usage limits, but not how queries against your warehouse are limited.
How often the query is wrong. The pages say nothing about accuracy. That is the reason to read the queries.
Results. There are no numbers on what marketing teams gained, and I have none of my own.
What I like about the shape Anthropic describes is that asking is quick, the answer shows its query and the animation is code a person can change. That shape rewards teams that already know what they mean by a number, and I would expect it to show the ones that do not. My sample reporting workspace uses made-up numbers and shows what I look at first in an account. The experiment I would run is whether a connected warehouse and a good question can get a team to that view without a ticket. It was announced on October 8, it is in beta, and my sources are Anthropic’s own pages, so take my enthusiasm for what it is. It also fits with where answers are heading: less to read, more to use.
Google's Gemini Decisions API, introduced on November 11, 2026, scores a fixed set of answers instead of writing text, in about 200 ms. What it is, what it costs, how Google's lead holds up against Artificial Analysis's own run, how to pair it with an LLM, and where a business could use it.
Mistral Large 4 (Le Chonk) is a model of about 1 trillion parameters whose weights Mistral released on October 29, 2026. What it is, what its license allows, what it costs to use and run, how the top open-weight claim holds up against Artificial Analysis's own runs, and where it could help.
Mistral's Timestral is a family of time-series models that forecast with a range, not one number. What it is, what it does, what its revenue-limited license allows, what I could and could not check in its benchmark claims, and where it could help e-commerce, tech and marketing.